This application shows trends of Stock/Index rates, and their transitions.
To trade Stocks, it is very important to know that current trend. It doesn't matter that the trade is day-trade, or a couple days/weeks swing trade. And it could be more important to know their transitions. The aim of this application is, trying to show them simple way.
The trends are drawn using least squares method, and by showing older lines, it is easily understand their transitions. Because this application is using unique method of showing transition of trends, please bear to read the whole contents of this document(sorry about some broken English).
* Support many stocks/indexes
* Download rates from internet (only daily)
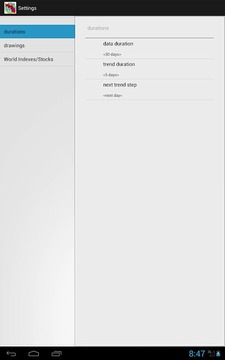
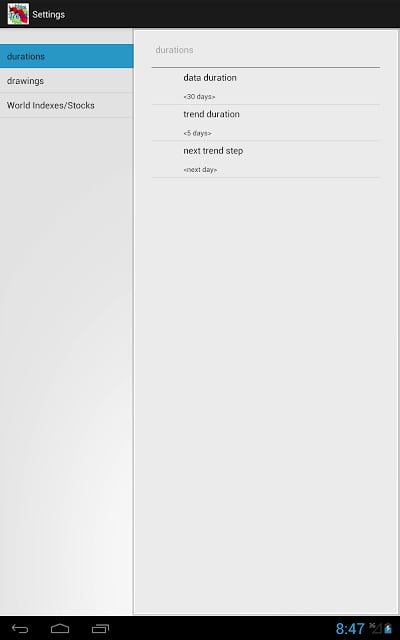
* Changing the duration of display
* Changing the duration of trend computation
* Changing next trend start duration
* show/hide of price rate
* show/hide of trend lines
* show/hide of trend transition
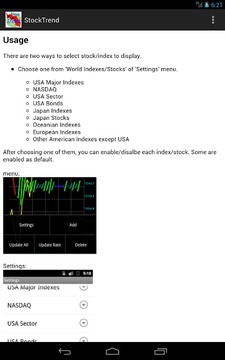
There are two ways to select stock/index to display.
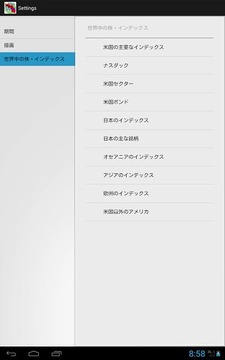
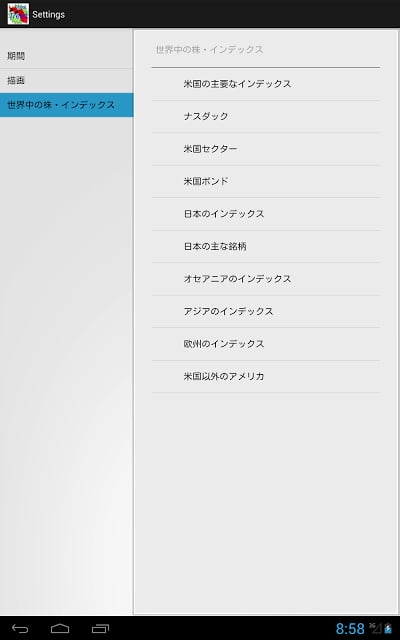
* Choose one from 'World Indexes/Stocks' of 'Settings' menu.
o USA Major Indexes
o NASDAQ
o USA Sector
o USA Bonds
o Japan Indexes
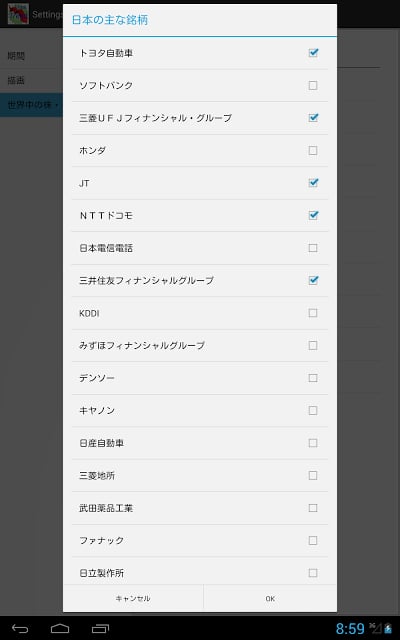
o Japan Stocks
o Oceanian Indexes
o European Indexes
o Other American Indexes except USA
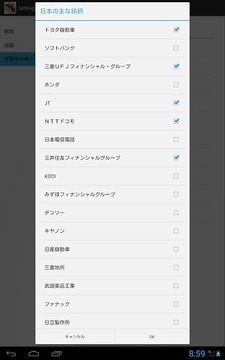
After choosing one of them, you can enable/disalbe each index/stock. Some are enabled as default.
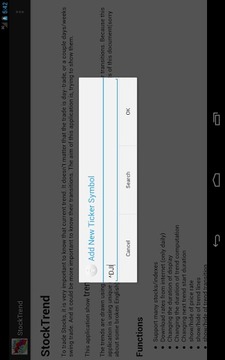
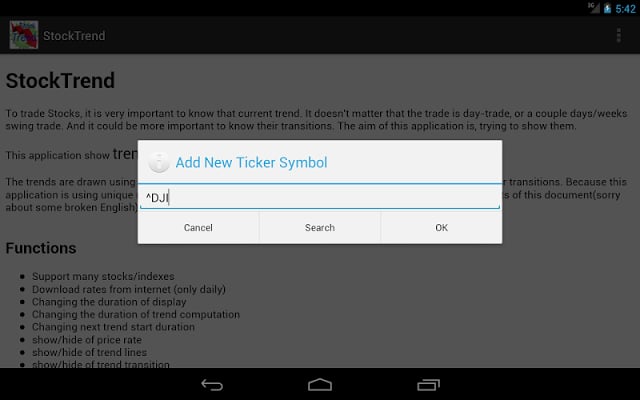
* Also, you can add ones by giving the ticker symbol. 'Add' from menu will display a dialog box. OK to add the new tick symbol. If you are not sure about the ticker, tap 'Search' to jump to Yahoo's searching page for ticker symbol.
Please remember that ticker symbol, in Japan, is 4 or 6 digit number. If you input numeric, it will try to connect Yahoo Japan.
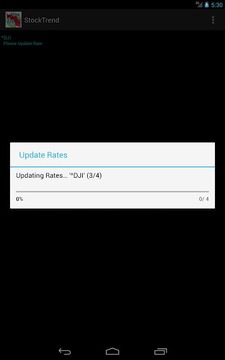
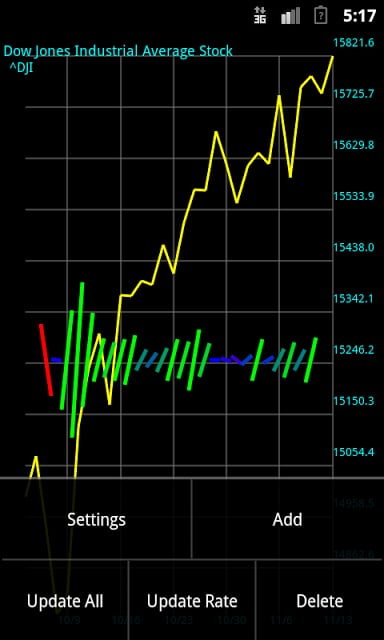
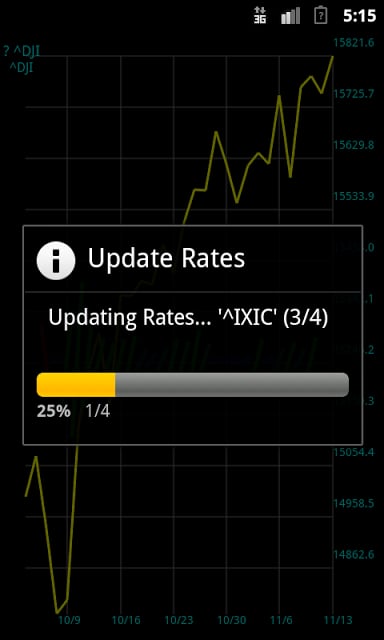
'Update All' or 'Update Rate' will download rates from the internet.
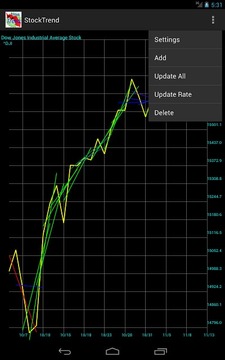
'Swipe' to change charts.
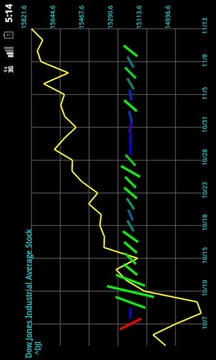
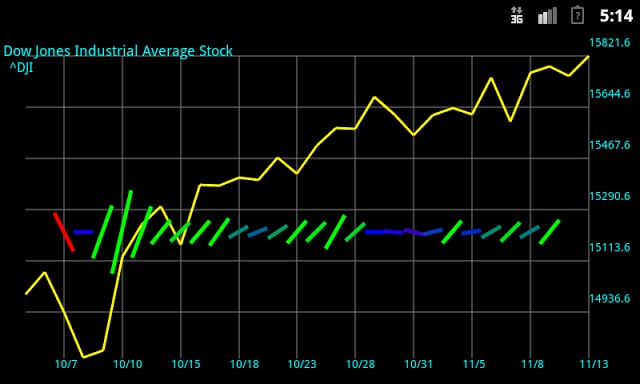
The closed prices are used to draw price line, except the last one is not close price but the latest price(Please remember that there should be a delay, or sometimes it cannot obtain the latest rate).
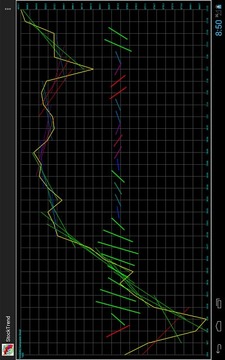
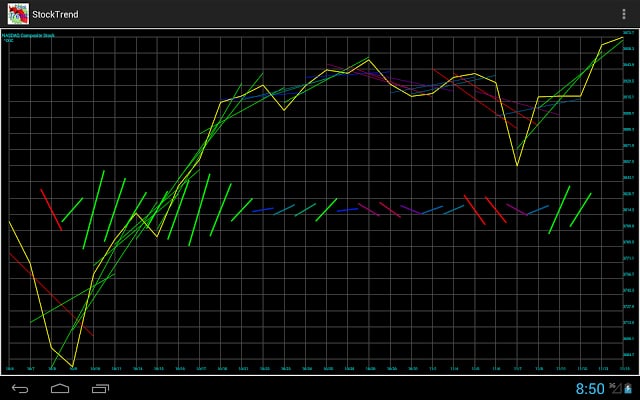
The colorfull straight lines will be drawn to show the transition of the trends.
Red/Right-side down, is down-trend. Green/Right-side up, is up-trend. And transition of trends can be easily seen.
In the documentation of the application, some artificial charts are given to show how trend trainsition look like at different situations.
'Trend' is calculated by N days price point and a straight line, if the total of distances of the pionts and the line become smallest. These lines can be shown from the menu. These straight lines on the price rate chart, are the these trends, but thier transition is not easily seen. Since the key point of the transition of the trends, is thier angles. Just put them of the certains point of Y-axis, is the 'transition of trends' above.
Disclaimer
We carefully designed this application for accurate computation but we cannot grantee it and you should understand it.
Directly or indirectly, No responsibility is assumed for the use of this document and applicaiton, and NO express or implied warranties or guarantees are made. This document and application are intended for educational and informational purposes only
Any live trading you do, you are doing at your own risk. You should be aware of all the risks associated with stocks/indexes trading. And if you do, you should not invest money you cannot afford to lose.
这个应用程序显示了股票/指数率的趋势,他们的过渡。
炒股,这是非常重要的知道,目前的趋势。不要紧,贸易是日内交易,或几天/周波段交易。它可能是知道自己的转变更为重要。本申请的目的是,试图展示他们的简单方法。
的趋势是使用最小二乘法得出,并通过显示旧生产线,这是很容易理解的过渡。因为这个应用程序是使用显示出趋势的过渡独特的方法,请大家多多阅读本文件的全部内容(抱歉有些蹩脚的英语)。
*支持许多股票/指数
*下载速度从互联网上(仅每天)
*改变显示的持续时间
*变化趋势计算的持续时间
*改变下一个趋势的开始时间
价格率*显示/隐藏
趋势线*显示/隐藏
趋势过渡*显示/隐藏
有两种方法来选择股票/指数显示。
*选择一项从“设置”菜单中的“世界指数/股票”。
Ø美国主要股指
Ø纳斯达克
ØUSA部门
Ø美国债券
Ø日本指数
Ø日本股票
Ø大洋洲索引
Ø欧洲指数
Ø除美国外的其他美国指数
选择其中之一后,您可以启用/ disalbe每个索引/股。一些被启用为默认值。
*此外,您还可以通过给股票代码添加的。从菜单中选择“添加”,将显示一个对话框。 OK添加新打勾符号。如果你不能确定的股票,点击“搜索”跳转到雅虎的搜索页面,股票代码。
请记住,股票代号,在日本,是4或6位数字。如果你输入的数字,它会尝试连接雅虎日本。
“全部更新”或“更新率”会从网上下载速率。
'刷'改变图表。
关闭价格用于绘制价格线,除了最后一个不是收盘价,但最新价格(请记住,应该有一个延迟,有时不能获得最新的利率)。
在创辉直线将被吸引到显示的趋势的转变。
红/右侧下降,下跌趋势。绿色/正面朝上,是上升趋势。和趋势的转变可以很容易地看出。
在应用程序的文档,一些人为的图表中给出,说明如何趋势trainsition看起来在不同的情况。
'趋势'由N天的价格点和直线的计算中,如果pionts的距离的合计与线路成为最小。这些线可以显示从菜单中。价格率图表上这些直线,是这些趋势,但Their授权修建的过渡并不容易看到。由于趋势转变的关键点,是Their授权修建的角度。只是把它们Y轴的certains点,高于“的趋势过渡'。
放弃
我们精心设计了这个应用程序进行精确的计算,但我们不能受让人它,你应该明白。
直接或间接承担任何责任对使用本文档和应用程序了,而任何明示或暗示的保证或担保制成。本文档和应用程序仅用于教育和参考
任何真实交易你做什么,你做你自己承担风险。您应该明白与股票/指数交易有关的风险。如果你这样做,你不应该投资的钱,你不能输不起。
株トレンド更新内容
Fixed a bug which crashes the app by entering a symbol includes '/'.
If you never used '/'(slash) in the symbol and will not use such a symbol, you don't need to update.
Thanks for the person who reported this problem.


网友评论更多