If you upload PV Solar Generation or Power Consumption data to pvoutput.org then this app is for you.
To get started, you will need your System ID and API Key from your Account Settings (http://pvoutput.org/account.jsp). Both are towards the bottom of your system settings on pvoutput.org.
Adding your initial system will also configure your Master API Detail. All calls to PVOutput.org are made using the Master API detail unless you override the API key on a per system basis.
Pull out the Navigation Drawer to go to your system. From there, swipe left and right, up and down to change views.
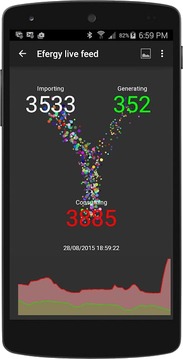
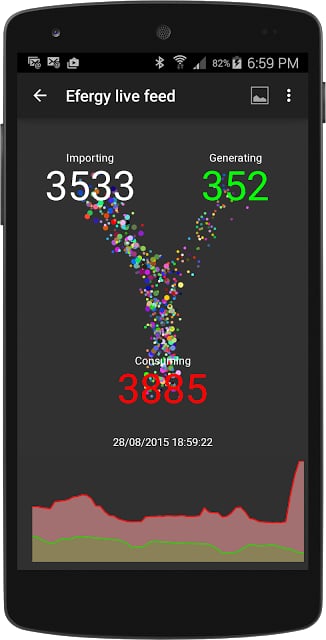
If you use Efergy, view your live statistics by subscribing and adding a Live Feed.
Edit your system settings via the Systems sub-menu. Set it as the default to go straight into the detail view for that system every time you launch the app.
If you don't have live Intraday data, edit your system and turn off the Intraday pages. Manually add your daily data directly from the app.
Access to pvoutput.org data is governed by the pvoutput.org API limits and restrictions. Making a donation to pvoutput.org will provide API bonus features that this Android app takes advantage of but it is not mandatory for basic app functions. See http://pvoutput.org/help.html#donations for further detail. Of particular interest are the following:
- Higher rate limits.
- The ability to retrieve detail and generation data for any system.
General features include:
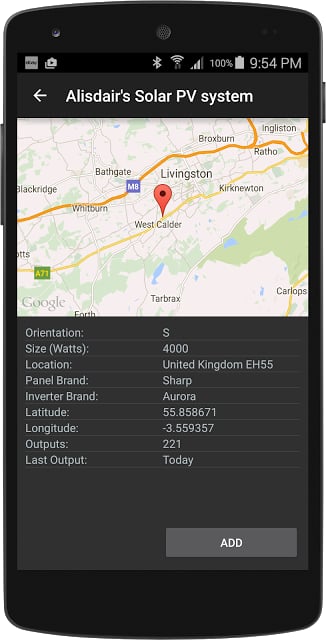
- Search for and Add any system on pvoutput.org. View limited system detail (including map) prior to adding.
- System Detail shows location using Google Maps and lifetime statistics
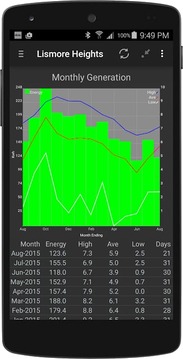
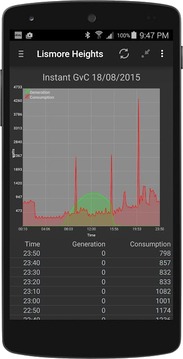
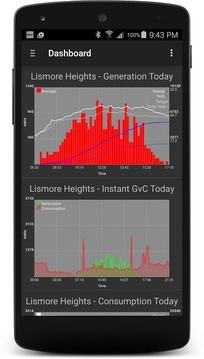
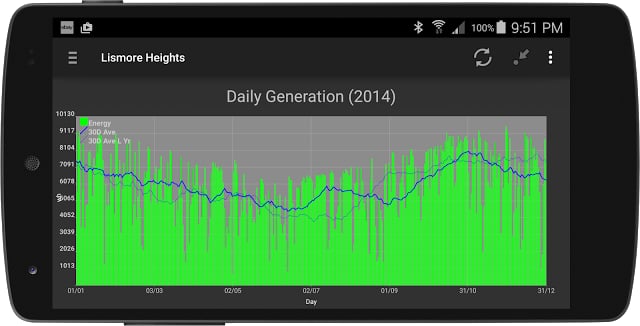
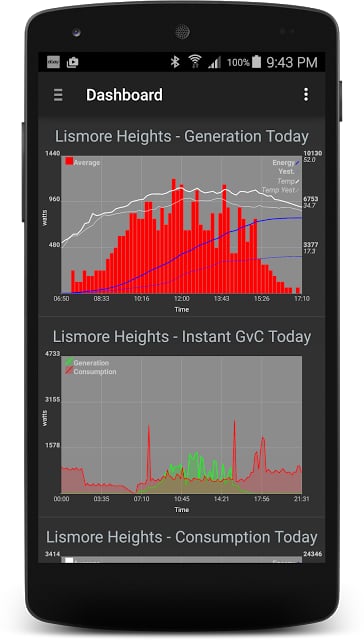
- Intraday, Daily, Weekly, Monthly and Yearly Generation and Consumption.
- Swipe left/right to move between days or keep swiping to move to Daily, Weekly, Monthly and Yearly.
- Swipe up/down to toggle view modes between Generation and Consumption or other views such as High/Average/Low.
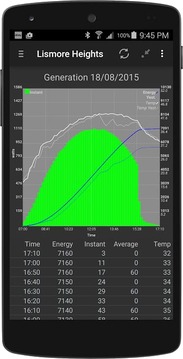
- Portrait shows Graph + List of data. Click on data heading to toggle display of Graph to view data list in full screen.
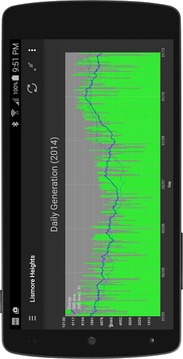
- Landscape shows full screen graph.
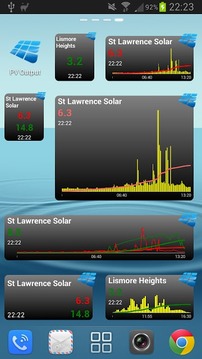
Home Screen Widgets:
- Pro Widget in-app subscription (7 day free trial) for additional 2x1 graph and 1x1 text home screen widget options.
- A single textual 2x1 home screen widget for Generation and Consumption data is enabled without having to subscribe.
- Click on the system name to re-enter the widget configuration screen.
- Optimise the width/height of the graphs for your screen.
- Place a 2x1, resize and then adjust the width/height via the widget configuration screen.
Drill Mode:
- Indicated by drill period in round brackets in page heading.
- When in drill mode, swipe left/right to move period. eg: move from month to month, year to year etc.
- Use the back button to exit Drill Mode.
- Access Drill Mode via list click or long press.
Want to go Ad Free?
You have two options:
1. Be an active supporter of pvoutput.org by making a donation AND join the 'McDonalds Android App' team on pvoutput.org
2. Ad Free in-app subscription (7 day free trial)
Show your support and join the PVOutput Android App Team. Join/Leave the Team directly from the app in the System Edit page or see http://pvoutput.org/ladder.jsp?tid=350
Don't hesitate to drop me an email (pvoutput@mcdonalds.id.au) with any problems or suggestions.
Use this link to join the Beta Test Group: https://groups.google.com/d/forum/pv-output-android-app-beta-test-group
This application uses Google Analytics to anonymously collect usage stats. You may opt out via an in-app preference. I hope you don't ... the stats keep me motivated ;)
如果您上传的光伏太阳能发电或功耗数据pvoutput.org那么这个程序是给你的。
要开始,你需要你的系统ID和API密钥从您的账户设置(http://pvoutput.org/account.jsp)。两者都是朝着对pvoutput.org系统设置的底部。
将您最初的系统也将配置您的主API的细节。所有来电均PVOutput.org使用的是主API的细节,除非您覆盖在每个系统的基础API密钥进行。
拉出抽屉式导航栏进入您的系统。从那里,刷卡左,右,上,下改变意见。
如果使用Efergy,通过订阅并加入实时输入查看实时统计信息。
通过系统的子菜单编辑您的系统设置。将其设置为默认的直来直去到每一个你启动应用程序时的详细视图该系统。
如果你没有活盘中的数据,修改你的系统,并关闭即日页面。手动直接从应用程序中添加你的日常数据。
访问pvoutput.org数据由pvoutput.org API限制和约束的约束。捐钱捐物,以pvoutput.org将提供API附加功能,这个Android应用程序利用了优势,但它不是强制性的基本应用功能。见http://pvoutput.org/help.html#donations了解进一步详情。特别感兴趣的是以下内容:
- 更高的速率限制。
- 要检索的细节和生成的数据对于任何系统的能力。
通用功能包括:
- 搜索并添加任何系统上pvoutput.org。查看有限的系统细节(包括地图)之前加入。
- 系统详细显示了使用谷歌地图,终身统计的位置
- 当天,每日,每周,每月和每年生产和消费。
- 刷卡左/右天之间移动或保持刷卡移动到每日,每周,每月和每年。
- 刷卡向上/向下切换生产和消费或其他见解,如高/平均值/低的视图模式。
- 肖像显示数据图表+目录。点击标题数据切换图形显示,以查看全屏数据列表。
- 景观显示全屏图。
主屏幕小工具:
- 临小部件在应用程序内订阅(7天免费试用)额外2X1图形和文字1x1的主屏幕小部件的选项。
- 允许一个单一的文本2X1主屏幕小部件的生产和消费数据,而无需进行订阅。
- 点击系统名称重新进入小部件配置屏幕。
- 优化图形的宽度/高度屏幕。
- 将2×1,调整再调整,通过小部件配置屏幕的宽度/高度。
钻模式:
- 圆括号在网页标题中所反映的演练时间。
- 在钻模式,刷卡左/右移动的时期。例如:从本月转移到一个月,每年等
- 使用后退按钮退出钻取模式。
- 通过列表中,单击或长按访问钻取模式。
想要去广告免费的吗?
你有两个选择:
1. pvoutput.org的积极支持者通过捐赠,并加入了“麦当劳Android应用程序”团队pvoutput.org
2.广告免费的应用程序,认购(7天免费试用)
显示您的支持与加盟PVOutput Android应用程序团队。加入/直接从应用程序离开球队,在系统中编辑网页或看见http://pvoutput.org/ladder.jsp?tid=350
不要犹豫,给我发电子邮件(pvoutput@mcdonalds.id.au)有任何问题或建议。
使用该链接加入到Beta测试组:https://groups.google.com/d/forum/pv-output-android-app-beta-test-group
此应用程序使用谷歌Analytics(分析)匿名收集使用情况统计数据。您可以通过在应用程序的偏好选择退出。我希望你不要......的统计让我的动机;)
PV Output更新内容
v2.14 (18 April 2016)
- PVOutput Teams - Search and add pvoutput.org Teams. Use the "Team" Search Type.
- Improve Efergy livefeed configuration - after validating the api token, configure which Efergy values to use as Generation and Consumption.
- Improve display of larger numbers on Daily, Week, Month and Year pages by rounding to kilo, Mega, Giga etc.
- Bug fixes - keep reporting them... thanks.
See full history and access older versions at www.pvoutputapp.mcdonalds.id.au


网友评论更多